Ball kicked to Landing Graphs
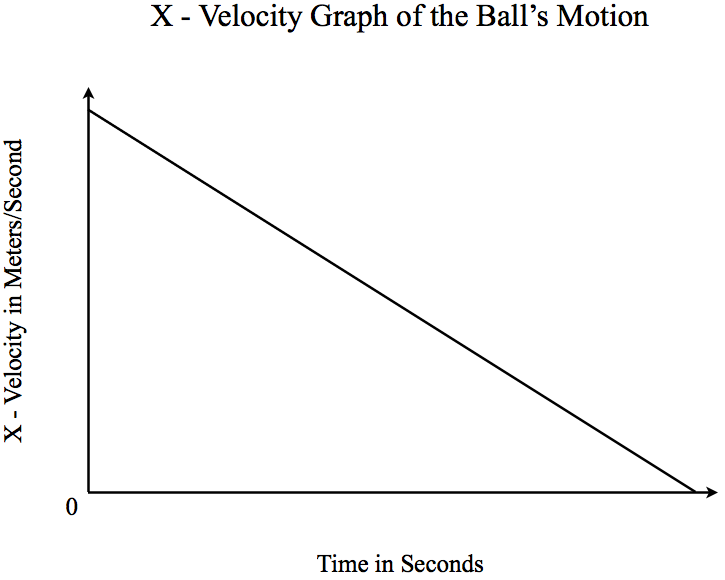
X - Velocity Vs. Time
|
The 'x' velocity of this system is essentially just the horizontal axis upon which the soccer ball has been kicked. To clarify, it would be like a real soccer ball kicked on the ground that stays on the ground. On a positional graph, the 'y' velocity would simply look like a straight line that eventually ends, as this is tracking the soccer ball's progress on the ground. This velocity decreases slower than the 'y' velocity because of the fact that it is, again, only on the ground, and therefore, it will be less affected by the force of gravity. This allows for a gradual and constant decrease in the position of the ball from it's point of origin.
|
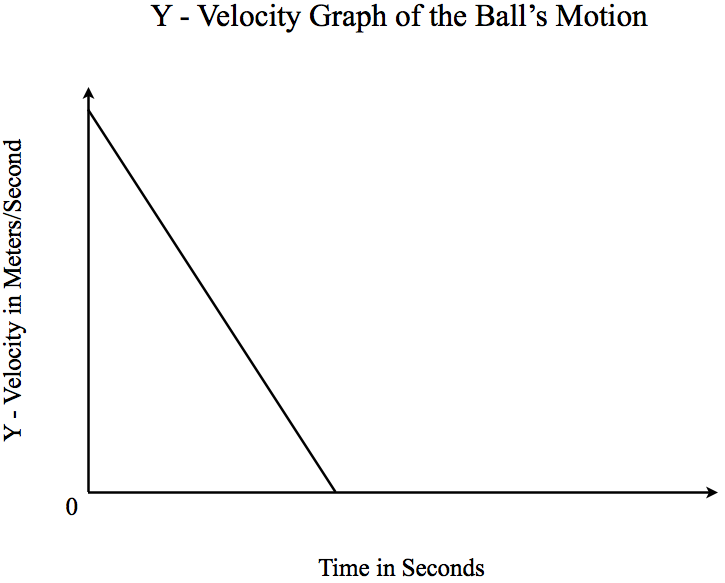
y - Velocity Vs. Time
|
The 'y' velocity of this lab comes with the 'projection' tag. Just as the 'x' velocity was the horizontal, and on ground position of the ball, the 'y' velocity is the upward trajectory that a lobbed ball takes from the path of it's original force (the foot) to it's endpoint, on the ground. This graph has a much steeper slope, as the trajectory of the soccer ball would look like a bell curvature on a position versus time graph for this specific example, and this is because of the high pull of gravity that makes the ball come down at a sharper speed. Basically, 'y' velocity is just the vertical movement of the soccer ball in air, not on the ground.
|
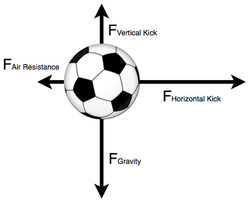
Free Body Diagrams Of the Ball's Projection
Ball at it's Highest Point
|
When at it's highest point, it has been proved time and time again that everything must come down... and this soccer ball is no exception to that age old rule. Here, because it has already reached it's greatest values regarding position and force, the soccer ball's vertical and horizontal values will now finally begin to decrease.
|
|
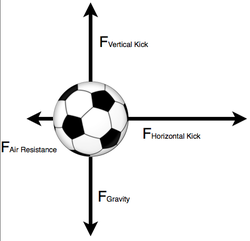
Halfway Up to Highest Point
|
When the ball is still halfway up to it's peak point, it actually begins to reach it's own maximum force values, as the soccer ball is now at it's fastest speed vertically and horizontally, and this will allow it to continue it's bell like trajectory in the air. Air resistance and gravity are still at similar values to the highest position, as shown above.
|
|
